
Curious to know how your vacation rental business is doing? Tracking the performance of your Airbnb listing is just as important as attracting new guests and increasing your bookings. It’s a quantifiable way of keeping an eye on your financial situation and overcoming key issues.
To give you a helping hand in understanding the KPIs of your Airbnb business, we’ll go over the most important ones and how you can start calculating them today. We’ll also go over how to use Google Analytics and recent insights from Airbnb.
What Are Airbnb KPIs?
The word KPI stands for “key performance indicator”. It refers to measurable values that indicate the performance and success of your Airbnb listing.
With Airbnb KPIs, hosts can periodically assess how their business is doing and make strategic decisions based on facts instead of feelings. These tools allow for comparisons to be made over time with objective evidence, making it easier to achieve goals and long-term improvements.
There’s an endless list of KPIs available so we have highlighted the most useful. Whether you have a small hotel or a cottage, these tools will help you take your business to the next level:

Occupancy Rate
The occupancy rate of a vacation rental is the number of days during a specific time period in which a property is rented out by guests. You might be wondering What is a high occupancy rate for Airbnb? According to a report by AllTheRooms, it’s anything over 65%. To increase your occupancy rate, you can consider using discounts or adjusting your pricing.
If you want to manually calculate the occupancy rate of your Airbnb listing, just divide the number of booked nights by the sum of the available nights. Let’s imagine that you rented your property out for 15 nights out of a 30-day month. To calculate the occupancy rate, you would just do the following:
# of booked nights ÷ # of available nights
15 ÷ 30 = 50%
Your occupancy rate for the given time period would be 50%.
Average Daily Rate
The average daily rate of a vacation rental indicates the average revenue that a rented room or property can earn in a day. While it’s a great indicator of what you can earn, it’s not fully accurate because it doesn’t factor in expenses like taxes.
You can calculate it by dividing the total revenue by the number of booked nights. If you’ve rented out five rooms in your B&B and the total revenue was $1,200 that day, the average daily rate would be $240.
Check out our Vacation Rental Encyclopedia to find out more about ADR.
RevPAR
Also known as revenue per available room, RevPAR is a great metric to get an overview of your business’ performance and increase your revenue.
There are two ways to calculate RevPAR. One is by multiplying the average daily room rate by the occupancy rate and the second is to divide the total room revenue by the number of rooms available in a given time.
Let’s say you made $4500 last month with a total of five rooms available. Your calculation for RevPAR would be the following:
$4500 ÷ 5 = $900
Check out our Encyclopedia entry about RevPAR to find out more.
Net Operating Income
The net operating profit is what’s earned after deducting expenses like the Airbnb commission fee, cleaning, maintenance, and management costs.
To calculate the NOI, just subtract the operating expenses from your gross income. Say your rental income is $200,000 but your expenses (including property management fees, repairs, insurance, and taxes) are $105,000. You would calculate the NOI as follows:
$200,000 – $105,000 = $95,000
Average Length of Stay
The average length of stay is the average number of nights that guests book your rental in a specific time frame. To calculate the ALOS, divide the sum of the number of nights booked for the month by the number of different reservations.
Imagine you had four different bookings last month and the number of nights for each booking was the following:
Booking 1 = 5 nights
Booking 2 = 3 nights
Booking 3 = 2 nights
Booking 4 = 3 nights
Total number of nights booked = 13
ALOS = # of nights booked ÷ # of different bookings
ALOS = 13 ÷ 4 = 3.25 nights
During the pandemic, the ALOS has increased as workationers look for new environments to temporarily live and work in. However, these numbers will most likely drop once travel picks up.
Check out our ALOS encyclopedia entry to find out more.
Understanding Airbnb Google Analytics
Although you can’t set up Google Analytics with your Airbnb profile, you can use it for your vacation rental website. Google Analytics is a critical tool that can help you to monitor traffic on your website, analyze your audience, and track individual pages. As a vacation rental owner, these KPIs reveal a lot of information that can later be used for your marketing and advertising strategies.
With Airbnb management software, you can even connect your rental website to your Airbnb account and generate reports on a single platform. A channel manager will automatically sync your calendars, rates, and bookings from external channels (like Airbnb, Vrbo, and Booking.com) and you’ll be able to analyze your business on a larger scale.

Key Airbnb Host Analytics
Airbnb knows how important it is for hosts to track their performance so they provide the means to do so. Here’s how it works:
- Go to Account Settings and turn on Airbnb’s Professional Hosting Tools
- Click on Performance at the top of the page
- You can now filter and compare different performance values over the past 12 months!
There are a total of seven tabs that you can explore in the Performance section. We’ll go over each one to give you an idea of what you can achieve by using them:
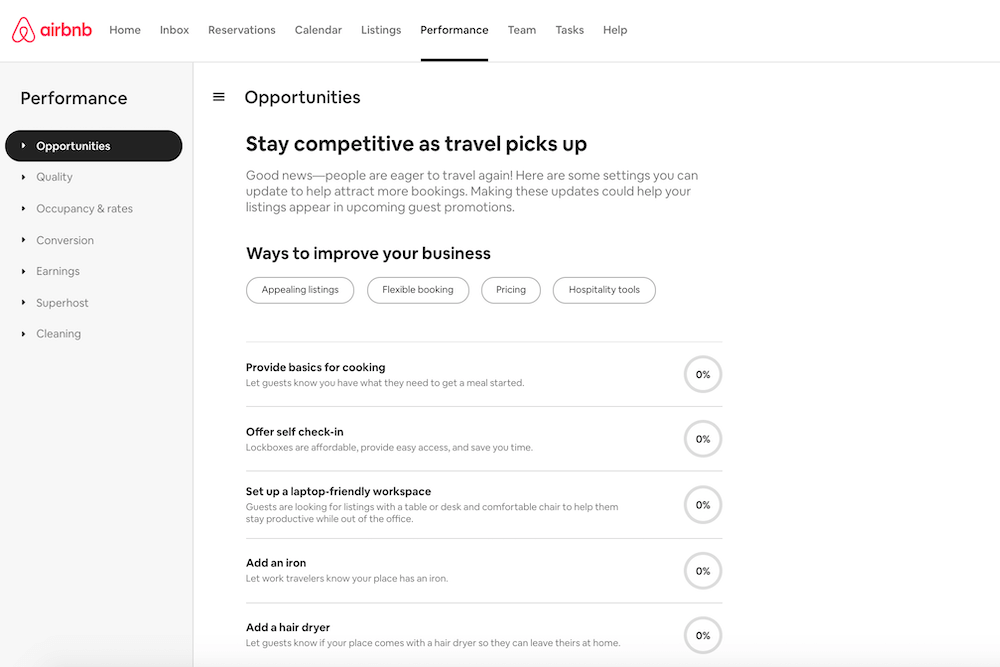
Opportunities
The Airbnb Opportunities section gives you tips on how to make your listing more competitive through flexible bookings, pricing, hospitality tools, and its overall aesthetic. You’ll be presented with a list of personalized recommendations and tabs to keep track of amenities and services that you offer. At the bottom of the page, you’ll come across the things you’ve already accomplished, also known as Completed Actions.
Quality
The Quality tab is extremely helpful for coming to conclusions based on the reviews that you have received. You’ll be able to get an overview of the opinions of guests with individual graphs for the overall quality, check-in process, cleanliness, communication, location, and value. The best part is that you can either choose to analyze your results over time or compare them to similar listings.
Occupancy & Rates
In the Occupancy & Rates section, you can filter and analyze your occupancy rate, cancellation rate, length of stay, and nightly rate. As previously mentioned, you can compare your property to similar listings which is a great help when making changes to your strategy.
Conversion
Airbnb also provides detailed information on your booking conversion rate, first-page search impression rate, average search-to-listing conversion, and average listing-to-booking conversion. You can also analyze your booking lead time, average returning guest rate, average page views, and wishlist additions.
Earnings
You can get a full overview of your earnings for each month, which can help indicate trends and seasonality for your specific Airbnb listing.
Superhost
For those aspiring to become a Superhost, Airbnb has a section that indicates your current status and the things you need to do to meet the criteria. This includes reaching a 4.8 overall rating, getting a 90% response rate, having over 10 completed stays or 100 nights over 3+ stays, and maintaining a cancellation rate under 1%.
Cleaning
While the cleaning section doesn’t include any KPIs, you will come across a cleaning overview, cleaning checklists, supplies and services, and resources to help you out!
Analyzing Airbnb Insights Report
Airbnb recently released a report of the platform’s full financial results of 2020 and their plan for 2021.
While Airbnb forecasted that the pandemic would drop their revenue to half of what it was in 2019, they were thrilled to announce that it had only dropped 30%. Due to charges related to the recent IPO, Airbnb’s net income in Q4 was directly impacted and resulted in a net loss.
In 2021, Airbnb looks forward to preparing for the travel rebound and continuing to perfect their product with over 5.6 active listings worldwide.
Conclusion
We hope that with this overview of Airbnb KPIs, you can set your vacation rental up for success. Keep a close eye on these metrics, stay organized, and be critical when analyzing flaws and opportunities. Feel free to comment below any doubts or questions you might have on the topic and we’ll get back to you as soon as possible!