
In recent years, investing in vacation rentals has become a popular real estate trend. The short-term rental industry’s annual revenue in the U.S. is expected to reach $20 billion by 2025 as more and more travelers choose to stay in vacation homes instead of hotels. Therefore, many investors are considering buying a vacation home to rent out for profit.
If you want to start or scale your business, it’s important to research the best short-term rental markets in advance because the property’s location is key to its success. It should be where both the demand for short-term rentals and rental income are high without breaking the bank to buy the property.
To help you decide where to buy a short-term rental, we have researched and analyzed property data across the web and compiled a list of the USA’s 10 best places to own a vacation rental.
What do we mean by the best places to buy vacation rental property?
There are many ways to define the top locations to own a short-term vacation rental. Since the ultimate goal of any real estate investor is to generate revenue, here we focus on the most profitable places for buying and owning a vacation home in 2023.
Using data from short-term rental analytics specialists AirDNA, advanced real estate data analytics tool Mashvisor, and property management solution Evolve, we’ll highlight the US markets with attractive cap rates for short-term rental investment.
For those of you who might be relatively new to the real estate investing world, cap rate – short for capitalization rate – is a real estate metric that is calculated by dividing the net operating income of a rental property by the current market value of the property. Although not the only indicator of success, it is an important marker for the best vacation rental markets.
Cap rate formula:
Cap Rate = Net Operating Income (NOI)/Current Market Value (CMV)
The cap rate is a relatively simple real estate profitability metric that allows investors to compare different housing markets and decide which offers the best opportunities to make money.
Vacation rental cap rates are on the rise
As the world’s travel industry opens up again, the demand for short-term rentals from investors and guests is increasing. The rising cap rates clearly demonstrate this. Overall, cap rates are anticipated to rise to 7% in 2023, according to GlobeSt.com.
Now is the time to invest in a vacation rental. Coming out of the peak season, many investors find that fall is the best time to buy up and invest in short-term rental real estate. With the cap rates in your favor, you can expect a good return on your investment as soon as you make the big purchase.
What cap rate is a good investment for vacation rentals?
What is the golden number if the cap rate is considered a good metric for your investment? As with most things in vacation rental investments, it depends.
A higher cap rate, typically speaking, projects a better investment, but it could also mean that it’s riskier. “Good” depends on how you’d like to define it. Striking a balance between high investment and risk is what will really determine what a good cap rate for your vacation rental is.

With that in mind, it’s advisable to hover between a 5-10% cap rate. Low cap rates of around 1 to 2% could still be profitable, but they’re typically found in highly saturated areas like bigger cities with a well-established short-term rental market.
On the other hand, a high cap rate could be a good investment, but it’s better suited for the gambler willing to take more of a risk.
Also, cap rates can be very specific to neighborhoods, boroughs, and particular areas. Sometimes if you zoom too far out and look at an entire county or city, you’re not going to get an accurate representation of the cap rate in your specific locality.
Take New York City, for example. Manhattan’s cap rate came in at 3.9%, while just a stone’s throw away in Queens, the cap rate is 5.03%. Your best investment should consider all these factors, as no two cap rates are created equal.
Best vacation rental property markets for 2023
The market is constantly changing, and last year’s top vacation rental markets differ from this year’s. We’ve looked at the best places to invest in vacation rentals, which we’ve made easy for you to consider with this list of locations with ideal cap rates, affordable median home prices, and high vacation rental occupancy rates.
| Market | Cap Rate | Median Home Price | Vacation Rental Occupancy Rate |
|---|---|---|---|
| Gatlinburg, TN | 9.2% | $301,725 | 74% |
| Windham, NY | 9.2% | $290,295 | 40% |
| Savannah, GA | 9.0% | $278,598 | 69% |
| Harpers Ferry, WV | 7.88% | $399,075 | 63% |
| Bryson City, NC | 7.8% | $246,333 | 63% |
| Bar Harbor, ME | 7.28% | $493,800 | 90% |
| Penn Yan, NY | 7.22% | $260,920 | 67% |
| The Poconos, PA | 6.7% | $271,985 | 72% |
| Branson, MO | 5.8% | $237,371 | 54% |
| Granbury, TX | 5.0% | $394,776 | 55% |
1. Gatlinburg, TN
- Cap rate: 9.2%
- Median home price: $301,725
- Vacation rental occupancy rate: 74%
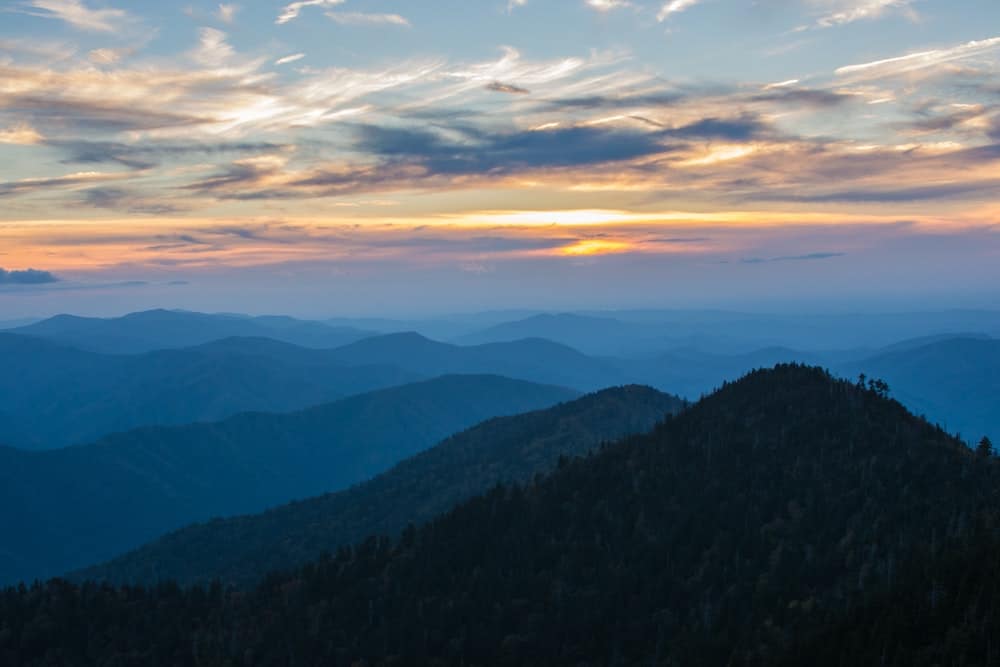
Gatlinburg is an idyllic destination for those wishing to explore the Great Smoky Mountains and the scenery of Sevier County. With over 14 million visitors descending upon the Smokies in 2021 alone, short-term rental investors can be sure to welcome outdoor enthusiasts throughout the year.
There are also various family-friendly attractions within close proximity, including Anakeesta Adventure Park, Ober Mountain, and Ripley’s Aquarium of the Smokies.
96% of Gatlinburg’s vacation rentals are entire homes, making it the ideal location to start a cabin rental business.
2. Windham, NY
- Cap rate: 9.2%
- Median home price: $290,295
- Vacation rental occupancy rate: 40%
Based just an hour’s drive from Albany in the heart of the Catskill Mountains, Windham, New York, can be considered one of the best vacation investment property locations for 2023. Many New Yorkers choose Windham as their getaway destination to escape the hustle and bustle of Manhattan.
The most successful short-term rental properties are big enough to accommodate families and large groups and often come with luxury amenities like hot tubs and fire pits. 92% of all vacation rentals in Windham are rated at least 4.5 stars by guests on Airbnb.
3. Savannah, GA
- Cap rate: 9.0%
- Median home price: $278,598
- Vacation rental occupancy rate: 69%
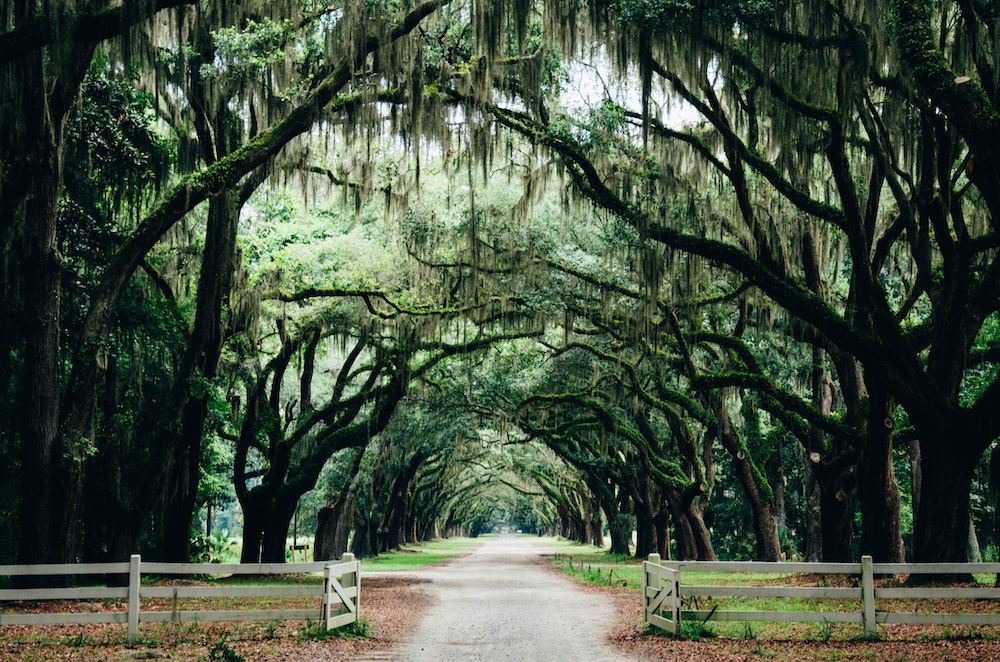
Savannah, Georgia, is full of Southern charm and is renowned for its picturesque Spanish moss and antebellum architecture. Guests of Savannah often make their way to the beautiful Forsyth Park and the waterfront on historic River Street. In 2020, 7.7 million of its 14.3 million visitors were overnight guests, which is expected to increase in 2023.
Investors should look to embrace the hospitality of the South and look for properties with architecture that the area has become famous for. 26% of Savannah’s short-term rentals are booked out between 181-270 days of the year with an average daily rate of $262.
4. Harpers Ferry, WV
- Cap rate: 7.88%
- Median home price: $399,075
- Vacation rental occupancy rate: 63%
This quaint West Virginia town sits at the confluence of the Potomac and Shenandoah rivers and is considered one of the best Airbnb markets this year. The Harpers Ferry National Historical Park, which boasts three miles of the Appalachian Trail, brings in thousands of visitors annually.
With each visitor comes a need for lodging, and with vacation rentals bringing an average monthly revenue of $3,595, it’s a perfect opportunity for short-term rental investors.
5. Bryson City, NC
- Cap rate: 7.8%
- Median home price: $246,333
- Vacation rental occupancy rate: 63%
Bryson City is also a popular destination for guests wishing to visit the Great Smoky Mountains National Park, where they’re treated to an abundance of outdoor pursuits, like hiking, white-water rafting, fishing, and biking. Those looking for a more relaxing getaway can enjoy a stroll through the town and take in the local bookstores and artisan craft shops.
The city is also known for its breweries and festivals, making it a top destination for guests and one of the U.S.’s best Airbnb markets. It’s also an ideal setting for a glamping business.
6. Bar Harbor, ME
- Cap rate: 7.28%
- Median home price: $493,800
- Vacation rental occupancy rate: 90%
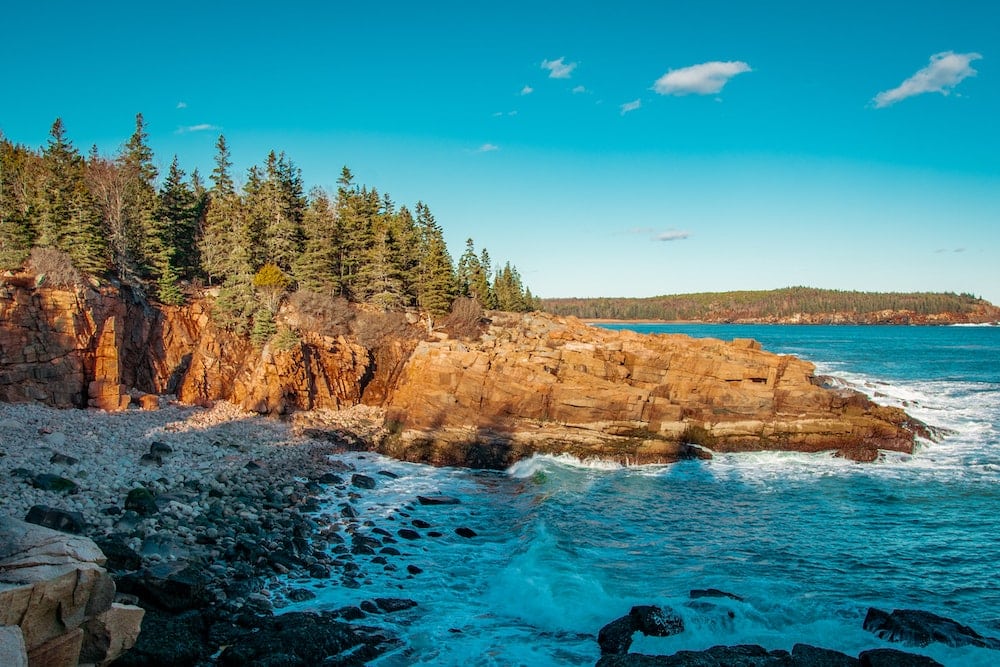
Bar Harbor is a stunning destination on Mountain Desert Island just off Maine’s Frenchman Bay. Its coastal views are some of the best in the country, and the town is hugely popular among visitors wanting to enjoy the local seafood and explore the islands by boat. Moreover, southwest of Bar Harbor is the unforgettable Acadia National Park, which is home to diverse wildlife, a glaciated coast, and cobble beaches.
Bar Harbor is one of the best places to buy vacation rental property as it has the potential to be a very lucrative market. It has an occupancy rate of 90%, and 40% of all rentals have a minimum night stay of 4-6 nights.
7. Penn Yan, NY
- Cap rate: 7.22%
- Median home price: $260,920
- Vacation rental occupancy rate: 67%
Lying on the north shore of Keuka Lake, Penn Yan is a small town that attracts people from around the country to visit its upmarket wineries and vineyards. It’s also popular for its local restaurants and breweries, as well as being an outdoor enthusiast’s dream. The Finger Lakes region is home to sublime natural beauty, as well as activities such as fishing, boating, and hiking.
Penn Yan saw its biggest rise in the number of short-term rentals last year and has an average monthly revenue of $5,034, meaning investors should consider buying here in 2023.
8. The Poconos, PA
- Cap rate: 6.7%
- Median home price: $271,985
- Vacation rental occupancy rate: 72%
The Pocono Mountains is another safe bet for your Airbnb investment. Ideal for family vacations and nature getaways, the area offers activities all year round, from golfing to skiing, and has a number of natural features such as lakes, waterfalls, and forested peaks that attracts around 30 million people every year.
Especially popular with guests from New York and Philadelphia, the top-performing short term rentals can earn as much as triple the median income here.
9. Branson, MO
- Cap rate: 5.8%
- Median home price: $237,371
- Vacation rental occupancy rate: 54%
Branson, Missouri, is renowned for its family-friendly attractions and its close proximity to an abundance of outdoor activities. Based in the heart of the Ozark Mountains, guests visit Branson looking to explore the miles of hiking trails and to enjoy various water sports, from paddleboarding to fishing on Table Rock Lake.
Famous for its country music scene and theme parks such as Silver Dollar City, Branson is busy all year round. Its short-term rentals have more than doubled since 2019, proving it to be one of the top vacation rental markets in 2023.
10. Granbury, TX
- Cap rate: 5.0%
- Median home price: $394,776
- Vacation rental occupancy rate: 55%
Situated right next to Lake Granbury, the town is a thriving short-term rental market and an ideal vacation destination from Fort Worth and Dallas, which are only an hour away. Visitors come to relax along Granbury City Beach Park and explore Historic Granbury Square. It’s home to a number of festivals and markets throughout the year, and guests can check out the miles of hiking and biking trails nearby.
46% of all rentals in the town are booked out for at least 90 days a year, and the median rental revenue per year is $28,305.
Legislation and taxes
Promising some of the highest returns on investment nationwide, these 10 destinations are currently some of the best places to buy a rental property in the U.S.
However, before you decide to become a vacation home investor in any of them, check the local short-term rental legislation before committing. In addition, familiarize yourself with the taxes and fees you will need to pay and research which states have the lowest property taxes for short-term rental investments.
If you’re looking to own an Airbnb in Texas, Florida, or California, you can check out our guides on Airbnb and short-term rental laws and regulations.
Once you have all legislation issues covered, you can embark on the exciting and profitable journey of investing in real estate and starting your vacation rental business!
Over to you
Buying a vacation rental is only the beginning of the adventure that lies ahead. Owning a short-term rental is a great investment, but it doesn’t end once you sign the deed. Any good vacation rental business needs property management software.
Try Lodgify with a no-commitment, 7-day free trial to see how you can manage your bookings, connect with major OTAs like Airbnb and Vrbo, and run your own website from one convenient place. Alternatively, you can book a personalized demo call with one of our specialists or request to use a demo account.
Contributing Author
![]()